
Class Overview Infographics
Challenge
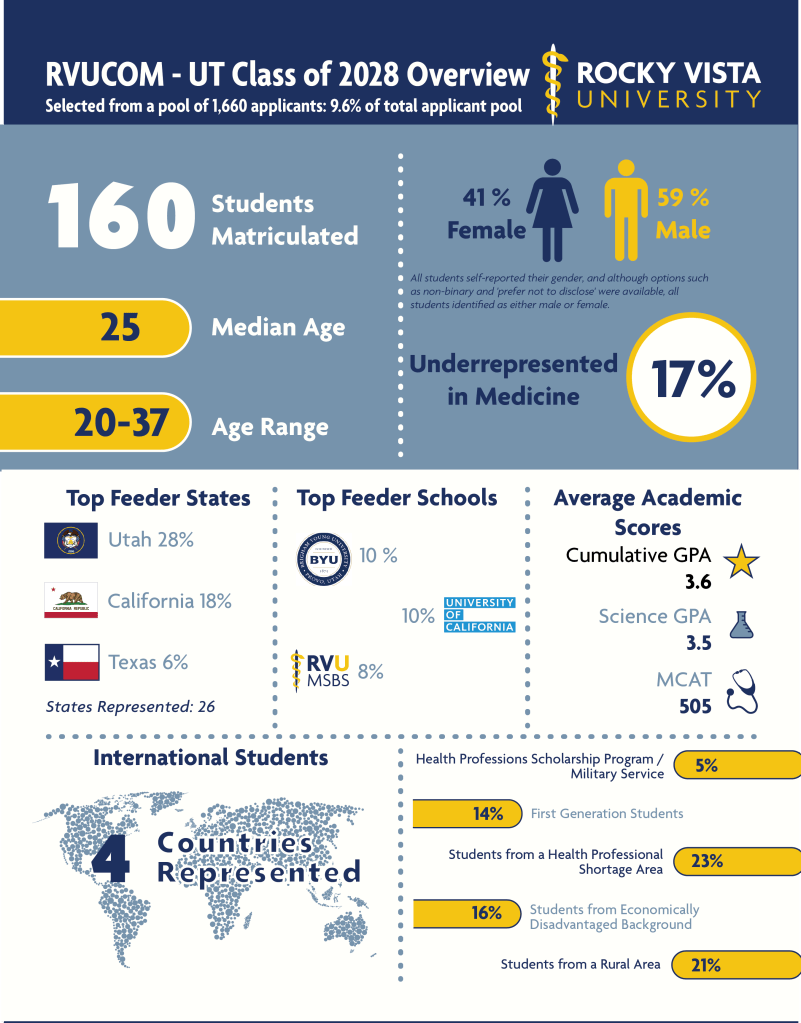
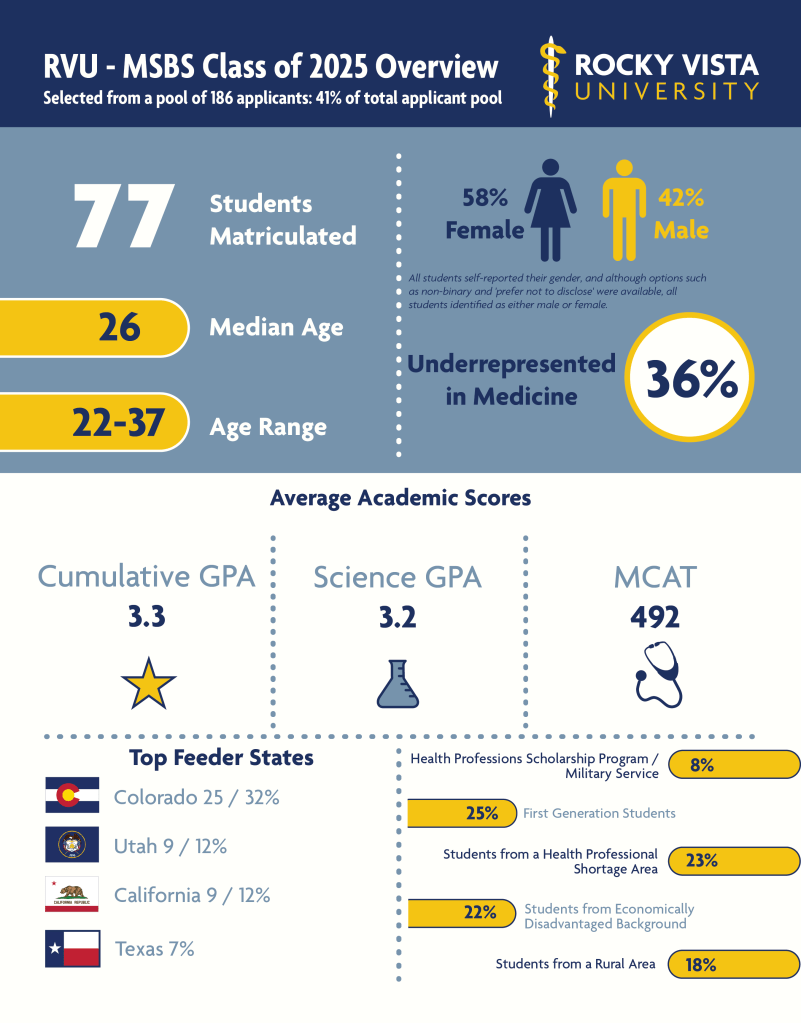
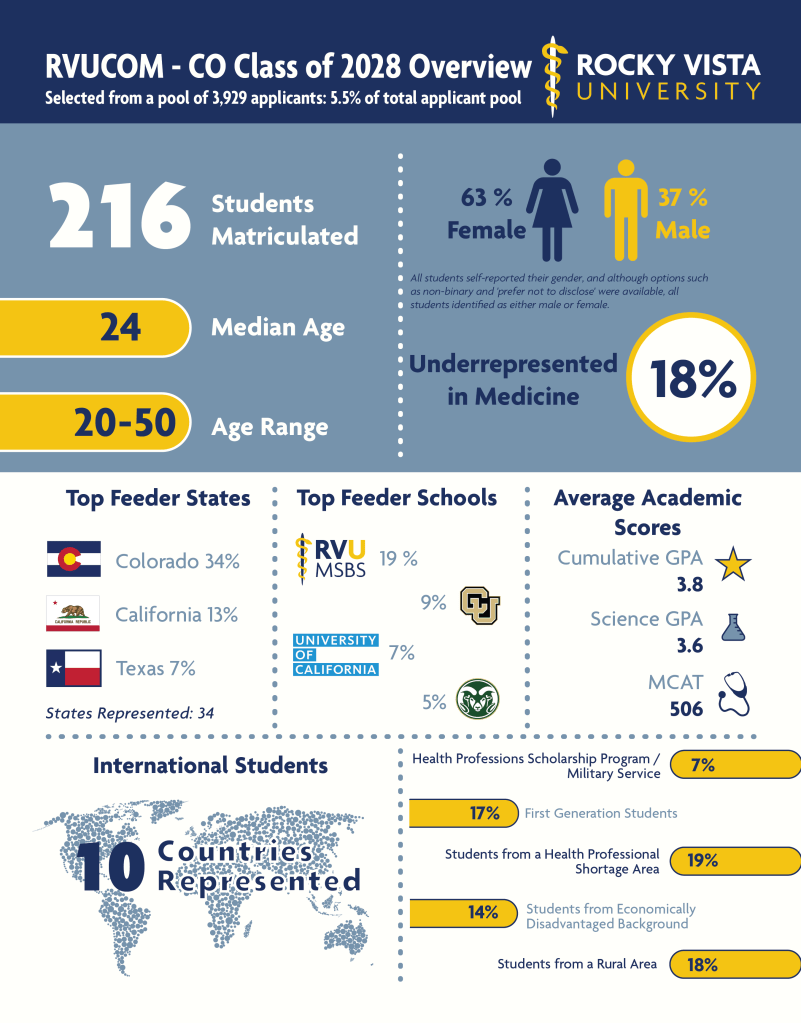
Rocky Vista University produces annual Class Overview infographics to highlight key demographic and academic data for each incoming medical school class. The original designs contained valuable information but were visually crowded, with inconsistent hierarchy and limited use of negative space. The University needed updated graphics that would feel modern, clear, and aligned with RVU’s brand identity.

Process
I redesigned the Class Overview graphics to improve readability and visual impact. My design process included:
- Refining the visual hierarchy to emphasize the most important statistics at a glance, such as class size, demographics, and feeder schools.
- Updating the layout and color scheme to better align with RVU’s brand standards, while creating a fresher, more professional look.
- Incorporating icons and graphics to reinforce key data points (e.g., gender distribution, GPA/MCAT scores, geographic representation).
- Balancing data density with readability, ensuring that each section felt distinct while contributing to a cohesive overall design.
- Introducing new elements such as an international student map, clearer labels, and updated callouts for diversity and representation metrics.
Outcome
The redesigned Class Overview infographics present complex student data in a streamlined, visually engaging format. By modernizing the design and strengthening the connection to RVU’s brand, the new version communicates key information more effectively and serves as a polished recruitment and marketing tool for prospective students, faculty, and partners.
